Global indexing is the cornerstone of modern passive investing. By tracking a single index, investors can instantly own a slice of thousands of companies across dozens of countries, effectively betting on the growth of the global economy rather than a single nation. For most investors, this “buy the haystack” approach is the most efficient way to achieve diversification and mitigate single-country risk.
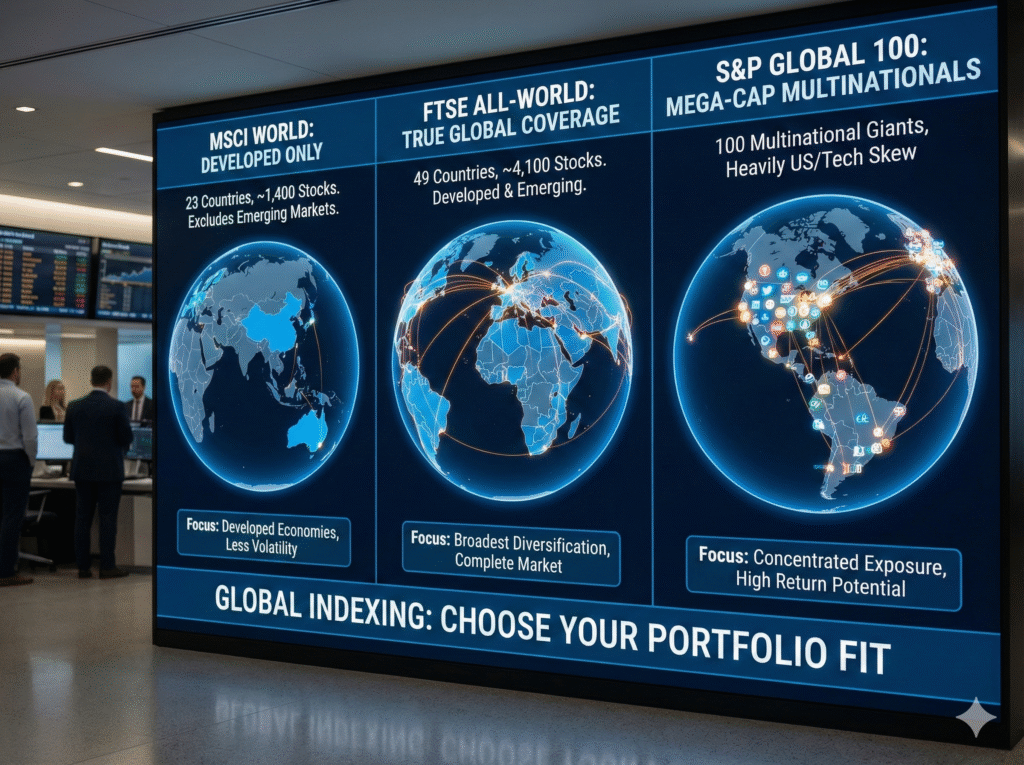
However, not all global indices are created equal. The two heavyweights—MSCI World and FTSE All-World—dominate the landscape, but they differ in critical ways regarding geographic coverage and methodology. A third player, the S&P Global 100, offers a radically different approach by focusing solely on mega-cap multinationals.
This guide compares these three indices to help you decide which one belongs in your investment portfolio.
Deep Dive: Composition and Methodology
Understanding the “engine” behind these indices is crucial. While they all offer global exposure, their definitions of “global” vary significantly.
1. Geographic Exposure: The Emerging Market Divide
The most significant difference lies in how these indices treat the world.
- MSCI World Index: Despite its name, this index does not cover the entire world. It tracks approximately 1,400 large and mid-cap companies across 23 developed countries (such as the US, Japan, UK, Canada, and France). It explicitly excludes emerging markets like China, India, and Brazil.
- FTSE All-World Index: This is a true “total world” index. It includes around 4,100 large and mid-cap companies from 49 developed and emerging countries. By tracking this index, you gain exposure to the same developed markets as the MSCI World, plus roughly 10-11% allocation to emerging economies.
- S&P Global 100: This index is far more concentrated. It tracks 100 massive, transnational corporations that derive a significant portion of their revenue from outside their home country. While technically global, its strict inclusion criteria mean it is heavily skewed toward US-based tech and consumer giants.
Key Geographic Weightings (Approximate):
- US Exposure: All three are US-heavy, but the S&P Global 100 is the most concentrated, often exceeding 80% US weighting. The MSCI World typically hovers around 70%, while the FTSE All-World is slightly lower (roughly 60-65%) due to the inclusion of emerging markets.
- China Exposure: The FTSE All-World includes China (roughly 2-3%), whereas the MSCI World and S&P Global 100 generally have zero direct exposure to Chinese listings, though they have indirect exposure through the revenue of multinational companies.
2. Sector Weightings
Your sector exposure changes depending on the breadth of the index.
- MSCI World & FTSE All-World: These indices are well-diversified across sectors. Technology is the largest component (roughly 20-25%), followed by Financials (15%) and Healthcare (12%). The inclusion of thousands of companies ensures that no single sector dominates the performance entirely.
- S&P Global 100: This index is a “mega-cap” beast. Because the world’s largest multinationals are currently tech giants, this index is heavily skewed. Technology can make up 40-45% of the index, with huge individual weightings in companies like Apple, Microsoft, and NVIDIA.
Performance & Risk
When analyzing MSCI World vs FTSE All-World performance, the results are surprisingly correlated, but distinct enough to matter over decades.
Historical Volatility and Returns
- Correlation: The MSCI World and FTSE All-World move in lockstep roughly 99% of the time. The 10% emerging market allocation in the FTSE All-World has historically added slightly more volatility. In periods where emerging markets underperform (as seen in the early 2020s), the developed-only MSCI World tends to slightly outperform. Conversely, when emerging markets boom (as they did in the mid-2000s), the FTSE All-World takes the lead.
- The S&P Global 100 Outlier: Due to its high concentration in top-performing US tech stocks, the S&P Global 100 has significantly outperformed broader indices in the recent “Big Tech” bull market. However, this comes with concentration risk. If the tech sector faces a downturn or regulatory headwinds, this index will suffer far more than the diversified MSCI or FTSE counterparts.
Concentration Risk
- FTSE All-World: Top 10 holdings make up roughly 18-20% of the index.
- MSCI World: Top 10 holdings make up roughly 20-22% of the index.
- S&P Global 100: Top 10 holdings can comprise nearly 60% of the index.
Investment Strategy: Which Index is Right for You?
Choosing between these indices depends on how you view emerging markets and your tolerance for concentration.
1. The “Set It and Forget It” Investor
Best Choice: FTSE All-World
If you want a truly passive, one-stop solution that covers the entire global equity market, this is your index. You don’t need to worry about rebalancing between developed and emerging markets; the index does it for you. It is the ultimate tool for broad diversification.
2. The “Core and Explore” Investor
Best Choice: MSCI World + Emerging Markets ETF
Some investors prefer to control their exposure to volatile emerging markets. By using the MSCI World as your “Core” (perhaps 85-90% of your portfolio), you can then add a separate Emerging Markets ETF to dial your exposure up or down to your liking. This offers more control than the FTSE All-World but requires more maintenance.
3. The “Mega-Cap Momentum” Investor
Best Choice: S&P Global 100
This is not a diversified broad-market index; it is a play on the dominance of the world’s biggest corporations. If you believe that massive multinationals with global moats will continue to crush smaller competition, this index fits. However, it should likely be a satellite holding rather than your entire portfolio due to its lack of diversification and heavy US/Tech skew.
Conclusion
The battle of MSCI World vs FTSE All-World largely comes down to a philosophical choice about emerging markets. The MSCI World offers a smoother, developed-market-only ride, while the FTSE All-World provides a complete picture of the global opportunity set. Meanwhile, the S&P Global 100 serves a different purpose entirely—offering concentrated exposure to the titans of the global economy.
Summary of Key Differences:
- FTSE All-World: ~4,100 stocks, Developed + Emerging. The most complete coverage.
- MSCI World: ~1,400 stocks, Developed only. Slightly less volatile, misses EM growth.
- S&P Global 100: 100 stocks, Mega-caps only. High return potential, high concentration risk.
For most long-term investors, the FTSE All-World remains the gold standard for a single-ticker portfolio, ensuring you own the winners of tomorrow, regardless of where they are listed.